This topic describes memory dumps.
A memory dump can occur in any of the following ways.
A manual dump is taken by choosing Advanced | Diagnostics | Memory Dump from the Operation screen of the software, or the user enters the keystrokes CTRL+ALT+F9.
The program calls function abort_int (this is the thing to do if your program finds itself in a place that is "impossible" to get to).
An interrupt occurs. In this case, the internal debugger is started, and a dump can be taken.
Debug is on (! on command line) and an exception, breakpoint, or single step occurs.
Every dump file has the same general layout; however, depending on the product and what options are included, there may be some differences.
The following information is generally included in a dump file.
Version – The software version is the first thing displayed.
Registers – The CPU registers at the time of the exception are displayed. This includes the current state of the interrupt controller mask bits.
Fault Location – The CS and IP registers in effect at the time of the exception or call to abort_int are displayed. If the value of CS:IP is determined to be within a "mapped" section of memory, then the module name (from the map_proc macro) is shown together with the offset within that mapping.
Reason for Dump – A line that gives the specific reason for the dump follows the register section. It reads "Program interrupted by:" and the specific reason, for example: "abort condition" (call to abort_int), "breakpoint" (int 3), "null int 6" (invalid op code exception), etc.
Screens – The name of each session and its current screen is displayed next. Typically this would be the OPER, DOS, and PRINT (i.e., SPOOL) sessions. Other session screens could be 3270 sessions, the GATE session, PRINTERS session, etc.
 Screens show up
in the dump only if they have been selected while running the program.
Link Trace – If a link trace is present, it appears next in the dump listing. The link trace can be an invaluable tool for debugging protocol violations. Each "link object" (SDLC, X.25, TRN, IPX, etc.) will produce a link trace specific to its protocol. The link trace is also a good starting point for details about host-to-Barr data traffic.
Buffers – All allocated buffers are displayed next. Buffers are discussed in more detail below.
Buffer Activity – This section displays a buffer activity log. It includes an entry for each of the last ten calls to the buffer management module. This is discussed in more detail below.
Mapped Segments – The rest of the dump file contains a section for each mapped segment. Segment-naming conventions are discussed below.
The screens section of the dump file is sometimes overlooked, but it often contains clues for solving a problem.
When looking at the OPER screen, note the following items:
Communication Scope
Error messages (DOS errors, low buffers, adapter errors)
Files being written, read, printed, or deleted
The time stamp of the console messages
The state of any printers or tape drives (LPT1, PR0E, TAPE)
The SPOOL screen is also useful for getting details about the current printing status of jobs in spool. When looking at the SPOOL screen, note the following items:
Status of printers and jobs
Number of bytes currently printed for a job that has been assigned to a printer
The form and class of the jobs and printers
The disposition field (are the files being retained or deleted?)
Remember, screens will show up in the dump only if they have been selected while running the program.
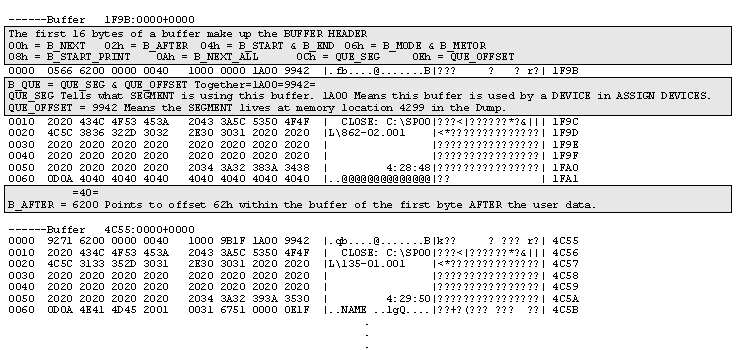
Buffers are used extensively throughout the Barr product. The first 16 bytes of a buffer are the buffer header. Data begins at offset 10H. The absolute maximum data offset within a buffer is given by the variable buffer_size_free. The value of buffer_size_free is calculated during program initialization. The variable b_after (second word of the buffer header) contains the offset within the buffer of the first byte after the user data. Notice that, in the dump file, the data shown for each buffer terminates in the line at offset b_after.
Another important field is b_que. This field is a double word in "segment:offset" notation and is located at offset 0CH in the buffer header, q_seg:q_offset. Every buffer resides on a queue. If the buffer is not allocated, then it lives on either free_que or xms_free_que.
A queue is a three-word data structure defined as follows:
Word 1 – This word is the segment address of the most recently added buffer on the queue. Following a call to get_buffer, this word will be the address of the buffer just allocated.
Word 2 – This word is the count of buffers on the queue. If this word is zero, then the queue is empty (and word 1 and word 3 must also be zero.)
Word 3 – This word is the segment address of the oldest buffer on the queue. A call to free_buffer or buffer_move will free or move this buffer, respectively.
Example 1 shows a sample buffer taken from a dump. This example is using Buffer 1F9B. The only significance of 1F9B is that, at the time this dump was taken, this buffer was located at memory location 1F9Bh.
The sample buffer given in Example 1 belongs to a device on the Assign Devices screen. Following is a list of the steps needed to find the associated device:
To determine if the buffer belongs to a device, examine the buffer header's que_seg, located at offset 0Ch. If it is equal to 1A00h, then the buffer belongs to a device.
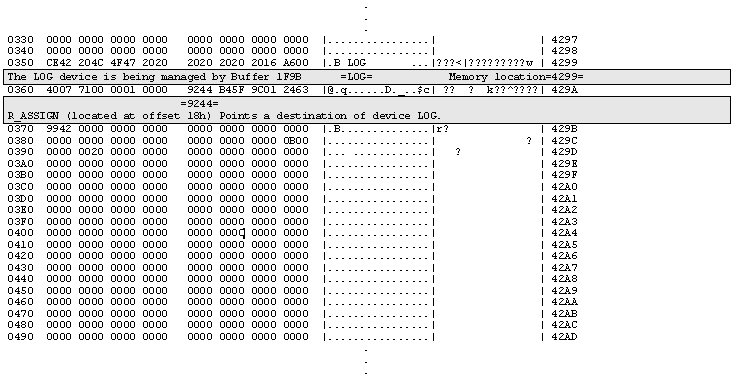
The segment for the buffer resides at the memory location pointed to when a byte swap is done on the variable que_offset. This example has que_offset = 9942, which points to memory location 4299 when the value is byte swapped.
To find the device, search for 4299 in the dump. When memory location 4299 is found, it is obvious the device in question is the LOG device.
Each device in assigned devices is assigned to a destination. Determining the destination is done by byte swapping the r_assign variable located at offset 18h in the segment belonging to the LOG device. This example has an r_assign value of 9244, which points to memory location 4492 when the value is byte swapped.
To find the assigned destination, search for memory location 4492 in the dump. In this example, the device LOG is assigned to SUSPEND.
Notice that the value of r_assign for the destination SUSPEND (also located at offset 18h) points back to the destination's (LOG) location in memory, 4492.

Search dump on byte swapped QUE_SEG to find the associated DEVICE

Search on byte swapped R_ASSIGN (4492) to locate DESTINATION of SOURCE

The buffer activity log is one of the most useful items contained in a dump file for development, because for all calls to get_buffer, free_buffer, and buffer_move, it lists the buffer, the source and destination queues, the action (get, free, or move) and the address of the caller. Note that each call to get_buffer and free_buffer contains an internal call to buffer_move with the source or destination queue being one of the free queues, respectively. Consequently, every G or F entry in the buffer activity log will be followed by its associated M entry.
|
Buffer |
This is the buffer being gotten, freed, or moved. |
|
Sque |
This is the source queue. For get_buffer, this will be the free queue. |
|
Dque |
This is the destination queue. For free_buffer, this will be the free queue. |
|
Action |
(F)ree buffer, (G)et buffer, or (M)ove buffer. |
|
By |
This is the CS:IP of the call to get_buffer, free_buffer, or buffer_move. |
The dump shows the activity of the last 10 buffers handled. Following is a sample activity log from a dump.
|
Buffer Activity |
|||||
|
|
Buffer |
SQue |
DQue |
Action |
By |
|
|
5B41 |
349D:62E4 |
43F5:0417 |
M |
263A:04A3 |
|
|
5324 |
349D:2BD6 |
349D:62E4 |
G |
263A:044B |
|
|
5324 |
349D:2BD6 |
349D:62E4 |
M |
1597:0530 |
|
|
5324 |
349D:62E4 |
43F5:0417 |
M |
263A:04A3 |
|
|
7EA8 |
349D:2BD6 |
349D:62E4 |
G |
263A:044B |
|
|
7EA8 |
349D:2BD6 |
349D:62E4 |
M |
1597:0530 |
|
|
7EA8 |
349D:62E4 |
43F5:0417 |
M |
263A:04A3 |
|
|
82E1 |
349D:2BD6 |
349D:62E4 |
G |
263A:044B |
|
|
82E1 |
349D:2BD6 |
349D:62E4 |
M |
1597:0530 |
|
|
82E1 |
349D:62E4 |
43F5:0417 |
M |
263A:04A3 |
The program maintains a list of mapped segments. Each map name is eight characters long (padded with spaces if necessary). There is a rather loose naming convention, which goes something like this:
|
'NAME |
' |
– represents a code segment, task_seg, or other data type not mentioned below. |
|
'NAME@ |
' |
– represents an area for local storage by module NAME. This resides is the global stack. |
|
'NAME# |
' |
– represents data within a code segment. |
|
'NAME! |
' |
– represents initialization data. |
 Some map names contain spaces before the @, #, or ! character.
The product segment can be used to determine the product code of the software that supplied the dump. To find the product segment, search for "--PRODUCT" in the dump. The word "product" can appear several times within a dump. Searching for "--PRODUCT" will yield something similar to what is shown in Example 2.

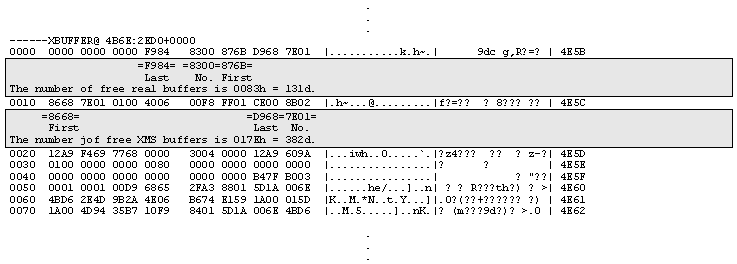
The XBUFFER@ segment will show how many real and XMS buffers were free at the time of the dump. The information on the real buffers starts at offset 0006h and the XMS data starts at offset 000Ch. To find this segment in the dump, search for "XBUFFER@." Example 3 gives a typical XBUFFER@ segment.
